Recently, I wrote some comments about the remainder of the current solar cycle. I am not overly optimistic about the possibility of good 6 m condx after this winter.
A long time ago I came to the conclusion that predictions are unreliable at best. But it is nevertheless interesting to look at some data and try to estimate the probability of cycle 25 to persist until the end of 2025.
The duration of solar cycles is exactly 11 years, believe it or not. Sunspot records exist since about 1748 or so and the peak of cycle zero was in 1750. I determined the peak dates of the past cycles, based on the smoothed values. I then tried to establish the first peak in 1750.
I shifted the start date around January 1750 so that the median deviation values became zero. In other words, the phase of a (cosine) wave was shifted so that it starts at 90 degrees (maximum amplitude).
If all cycles are taken into account, the zero point is January 1750 and for cycles 10 and up, the zero point shifts to February 1750.
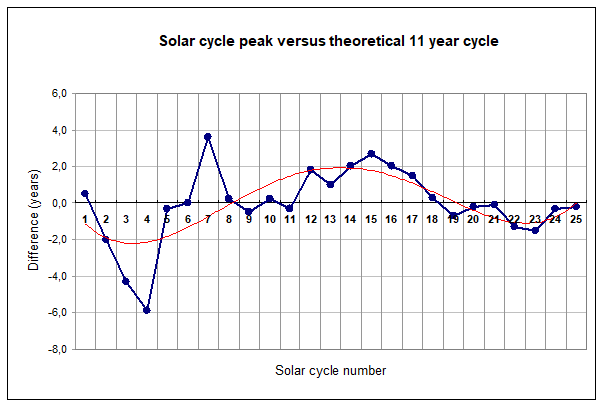
A graph of the differences between each cycle peak and exact 11 year cycles, starting with cycle 1 is shown below.
A positive value means that the cycle is late, negative values indicate early cycles. The peaks of cycles 3, 4 and 7 deviate substantially from the 11 year cycle. From cycle 10 onward, the deviation is less than two years (except cycle 15). It cannot be ruled out that sunspot counts were less accurate in the past. It is also unknown to me if counting methods were always the same. The larger deviations could be related to inconsistencies.
Nowadays, methods are well established and should be more consistent . I am tempted to reject the earlier outliers and start from cycle 10 onwards.
Based on that approach, the 11 year peak of the current cycle is early 2025. The peak was recently called by scientists to be mid October 2024. This date was used for this analysis.
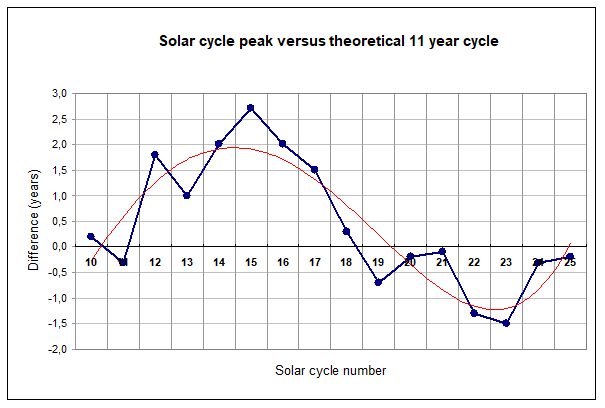
Another observation is that the graph suggests a slow cycle with a period of roughly 15 cycles. The trend line (polynomial regression 4 periods) shows that. The next graph is based on cycles 10 and up. The trend line fits the data points pretty well.
If this is true, the coming cycles could be increasingly late, to reverse cycle 29, which should be around 2 years late. I will not be able to verify that assumption 
The trend line at cycle 25 is near zero, which would imply that cycle 25 is “on time” and should peak early 2025.
We have seen that some cycles have very active final phases. If we look at detailed graphs or past cycles, there seems to be a tendency for the first monthly mean peaks to be somewhat stronger than the later ones. The numbers also suggest a slight dip around the centre of the cycles and many have double peaks.
The optimistic scenario is that a double peak will occur and that we are near the centre dip. If that would be the case, cycle 25 is not over yet and raise the probability of 2025 being good for 6 m
F2 critical frequencies become very high in the winter period at mid latitudes (the winter anomaly) and we need the solar activity to peak during that period. The anomalies in the northern and southern hemisphere differ 6 months. Some studies suggest that the winter anomaly is less in the southern hemisphere.
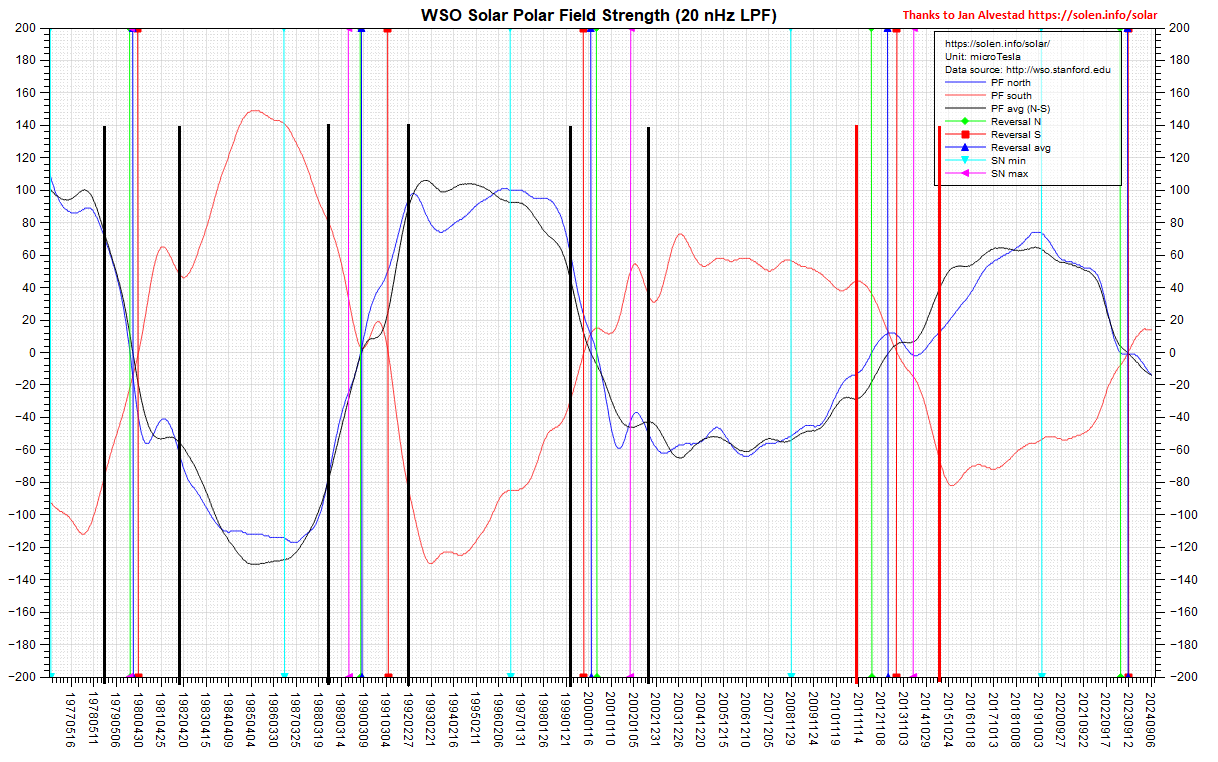
A very interesting graph which I found quite some time ago, is published by Jan Alvestad. He has been publishing solar-terrestrial info for a very long time and he updates his website daily.
Click on the picture to enlarge it.
Lines were added at the times when a cycle becomes very active and at the time when the activity starts dropping quickly. This graph suggests that the high solar activity is linked to the polar fields of the sun. During the first phase, the polar fields are changing relatively quickly. Towards the end of the active phase of the cycle, the fields stabilise after they have changed rapidly. If this correlation is true, we are not yet at this stabilising phase and that would mean that we have roughly another year to go.
The graph also suggests that stronger fields are associated with more active cycles. Given the relatively lesser fields strengths which resemble the previous cycle to some extent, this aspects reduces the probability of strong enough solar fluxes for 6 m F2 propagation.
Wait and see it the motto. The final verdict will be given by Mother Nature!


