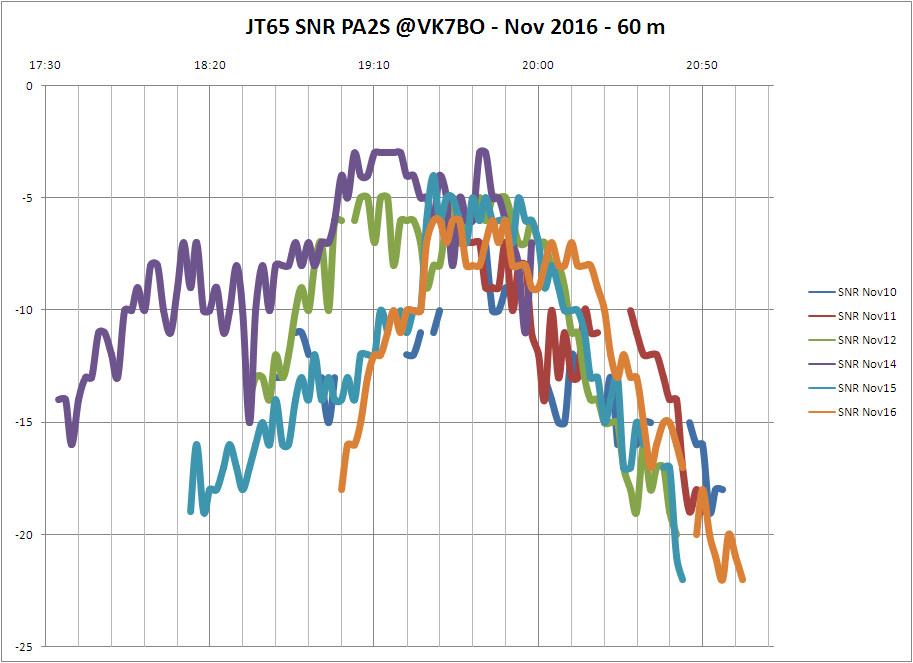
Both 15 and 16 November 2016 had good openings again. Data of 6 openings is gathered now.
Below is a graph of these 6 openings, again with SNR against UTC. The differences are remarkable, especially at the beginning of the opening, but towards the end, the pattern is more “in sync”.
I again used about 50 Watts, but during the last hour, the the power was increased to 100W, after the spots were lost. I wanted to track the decay as good as possible. The SNR was adjusted with 3 dB for these periods.
Over time, I will try to get more results and will dig deeper into the subject.

